The following table shows the swim times s for a certain swimmer for the 400-meter freestyle swims during the years 2001 to 2007. Let represent the year 2001.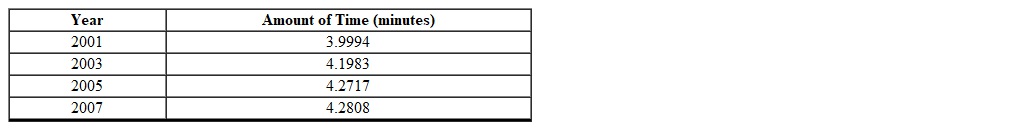
Which one of the following equations is the line of best fit for the data provided? (Rounded to the nearest ten-thousandths)
A) 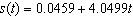
B) 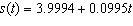
C) 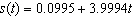
D) 
E) 
Correct Answer:
Verified
Q46: An economist models the market for rice
Q47: Find an equation for the line passing
Q48: Which one of the following is the
Q49: A swimming pool is being filled with
Q50: The following table shows the values of
Q52: The following table shows the values of
Q53: m is directly proportional to n .
Q54: Biologists observed that as the temperature t
Q55: Biologists observed that as the temperature t
Q56: Find an equation for the line that
Unlock this Answer For Free Now!
View this answer and more for free by performing one of the following actions

Scan the QR code to install the App and get 2 free unlocks

Unlock quizzes for free by uploading documents