Multiple Choice
The following figure shows the annual sales (in millions of dollars) of sporting goods in the United States from 1994 to 2000, where represents 1994. Use the figure to approximate the sales of sporting goods (in millions of dollars) in . 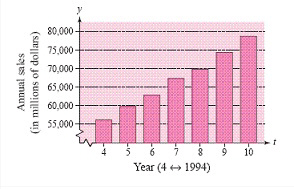
A) $
B) $
C) $
D) $
E) $
Correct Answer:
Verified
Related Questions
Q111: The distance traveled is given by rt
Q112: Evaluate Q113: Evaluate Q114: The value of p pennies, n Q115: Evaluate the algebraic expression Q117: Evaluate Q118: Evaluate the algebraic expression Unlock this Answer For Free Now! View this answer and more for free by performing one of the following actions Scan the QR code to install the App and get 2 free unlocks Unlock quizzes for free by uploading documents

