You have just constructed the chart displayed below: 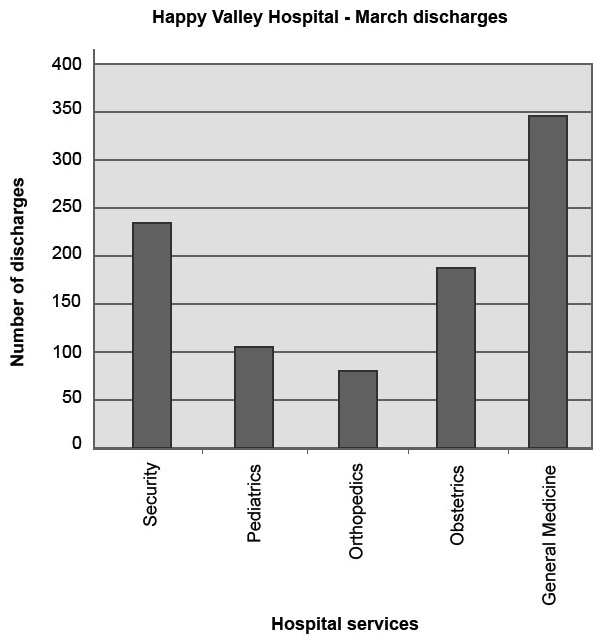 The names of the hospital services are hard to read. The best way to deal with this problem would be to
A) construct a line graph instead of a bar chart.
B) use a column chart instead of a bar chart.
C) plot your primary variable along the x axis.
D) divide the data into two charts.
Correct Answer:
Verified
Q1157: A patient admitted to the hospital on
Q1158: The inpatient census at midnight is 67.
Q1159: Mr. McDonaldson was admitted to your hospital
Q1160: The major purpose of random assignment in
Q1161: William Rumple was pronounced dead on arrival
Q1163: The best form/graph for demonstrating trends over
Q1164: The number of deliveries in the facility
Q1165: Look at the graph grid displayed above.
Q1166: Use the statistics provided in the table
Q1167: Sea Crest Hospital has 200 beds and
Unlock this Answer For Free Now!
View this answer and more for free by performing one of the following actions

Scan the QR code to install the App and get 2 free unlocks

Unlock quizzes for free by uploading documents