Refer to the figure.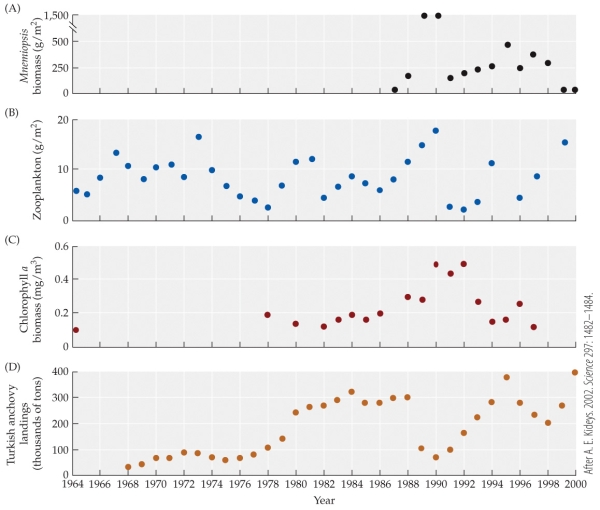
- Based on the figure, which of the following most likely explains the rapid increase in zooplankton between 1996 and 1999?
A) Rapid decrease in chlorophyll a
B) Rapid increase in anchovies
C) Rapid decrease in Mnemiopsis
D) Rapid increase in Mnemiopsis
Correct Answer:
Verified
Q1: The addition of excess nutrients into aquatic
Q2: Which statement about the effects of the
Q3: Which statement about the Black Sea is
Q4: Refer to the figure. Q6: During a hurricane, a large segment of Q7: During the 1950s and 1960s, the cattle Q8: Which statement about cattle egrets in the Q9: Refer to the figure. Q10: Refer to the figure. Q11: Which pattern of population dynamics best describes Unlock this Answer For Free Now! View this answer and more for free by performing one of the following actions Scan the QR code to install the App and get 2 free unlocks Unlock quizzes for free by uploading documents![]()
![]()
![]()

