(Figure: Deadweight Loss) Which area represents deadweight loss as a result of the tariff?
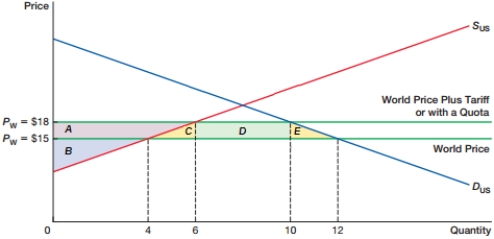
A) C
B) C + D + E
C) C + E
D) E
Correct Answer:
Verified
Q88: (Figure: Gains From Trade A) Which of
Q89: (Figure: Gains From Trade A) Which of
Q90: (Figure: Gains From Trade A) Which of
Q91: (Figure: Gains From Trade A) Which of
Q92: (Figure: Gains From Trade A) Which of
Q94: (Figure: Deadweight Loss) Which area represents tax
Q95: (Figure: Deadweight Loss) Which area represents producer
Q96: (Figure: Deadweight Loss) Which area represents producer
Q97: (Figure: Deadweight Loss) Which of these groups
Q98: The economic burden of a tariff tends
Unlock this Answer For Free Now!
View this answer and more for free by performing one of the following actions

Scan the QR code to install the App and get 2 free unlocks

Unlock quizzes for free by uploading documents