The graph shows a shift in saving supply to the right. This would MOST LIKELY occur in case of: 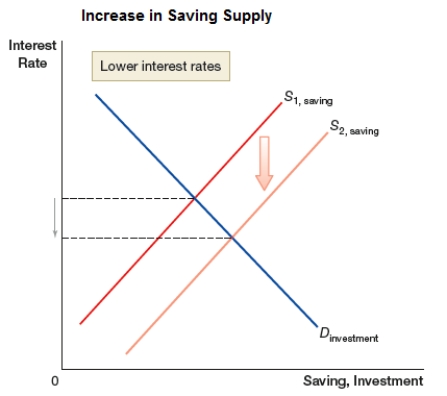
A) a large government deficit.
B) a decrease in foreign saving.
C) higher taxes on savers.
D) lower taxes on savers.
Correct Answer:
Verified
Q60: Higher saving has what impact on the
Q61: The market interest rate is determined by
Q62: The market interest rate is determined by
Q63: The graph shows a shift in investment
Q64: The graph shows a shift in investment
Q66: The graph shows a shift in saving
Q67: One purpose of the 2018 reduction in
Q68: Which of the following is one of
Q69: A news headline states that "Lower interest
Q70: Misaki is considering three options that her
Unlock this Answer For Free Now!
View this answer and more for free by performing one of the following actions

Scan the QR code to install the App and get 2 free unlocks

Unlock quizzes for free by uploading documents