Consider a study in which trees of two species (elm and oak) were assayed to determine what the probabilities are of being infected with a disease. The probabilities that resulted are shown in the probability tree. Which of the columns in the data table below accurately represents the probability values in the probability tree?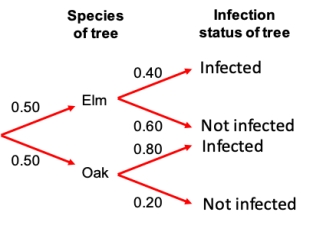
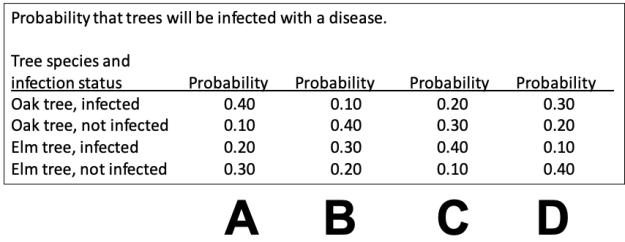
A) Plot A
B) Plot B
C) Plot C
D) Plot D
Correct Answer:
Verified
Q16: Consider a collection of 240 snakes where
Q17: Consider a collection of 240 snakes where
Q18: Consider a collection of 240 snakes where
Q19: Consider a study in which trees
Q20: Consider a study in which swabs
Q22: Consider a study in which swabs from
Q23: Imagine we are catching fish from a
Q24: Imagine we are catching fish from a
Q25: Imagine we are catching fish from a
Q26: Imagine we are catching fish from a
Unlock this Answer For Free Now!
View this answer and more for free by performing one of the following actions

Scan the QR code to install the App and get 2 free unlocks

Unlock quizzes for free by uploading documents