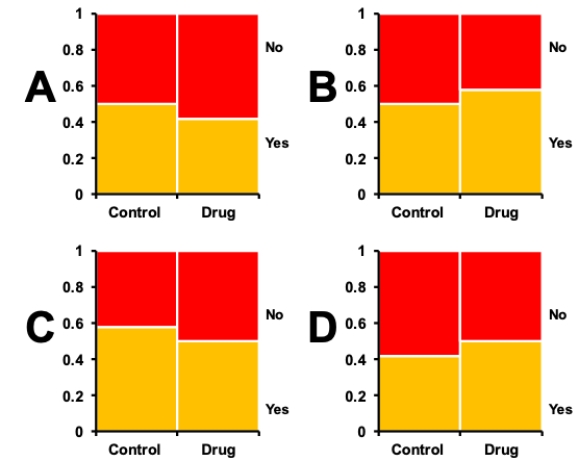
Consider a situation in which tumor-prone rats were given an experimental anti-cancer drug or a control. There were 50 rats in each treatment group, and after 6 weeks they were sacrificed and autopsies performed to determine the presence or absence of liver tumors. The table shows the results of the measurements. Which of the mosaic plots shown correctly depicts this data?
?
Contingency table showing presence of tumors in rats with different drug regimes.
? ?
?
A) Plot A
B) Plot B
C) Plot C
D) Plot D
Correct Answer:
Verified
Q25: Consider the histogram shown. What two words
Q26: Consider the histogram shown. What two words
Q27: What of the following is the best
Q28: Consider a situation in which bacterial
Q29: Consider a situation in which bacterial
Q31: Consider a situation in which bacterial
Q32: Mosaic plots and grouped bar graphs display
Q33: Consider an experiment in which rats are
Q34: Consider an experiment in which rats are
Q35: Which of the following is a good
Unlock this Answer For Free Now!
View this answer and more for free by performing one of the following actions

Scan the QR code to install the App and get 2 free unlocks

Unlock quizzes for free by uploading documents