For the figure shown, which of the four plots most likely shows a situation where both factors have a significant association with the response variable?
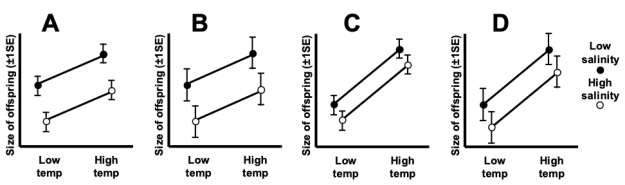
A) Plot A
B) Plot B
C) Plot C
D) Plot D
Correct Answer:
Verified
Q14: The interaction plot shown most likely represents
Q15: The interaction plot shown most likely represents
Q16: The interaction plot shown most likely represents
Q17: The interaction plot shown most likely represents
Q18: The interaction plot shown most likely represents
Q20: For the figure shown, which of the
Q21: Consider an experiment using birds in which
Q22: In the preliminary stages of an ANCOVA
Q23: Which of the following is not an
Q24: When the assumptions of the linear model
Unlock this Answer For Free Now!
View this answer and more for free by performing one of the following actions

Scan the QR code to install the App and get 2 free unlocks

Unlock quizzes for free by uploading documents