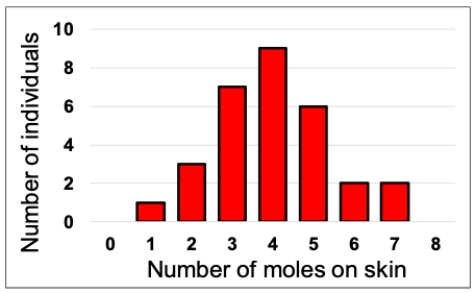
Consider the figure shown indicating the number of moles on the skin of a set of 30 patients examined by a dermatologist. Published reports claim that the mean number for the population these patients come from is 3.4 moles. Conduct a one-sample t-test on this data and determine whether this seems to be true. Assume a = 0.5. In your answer, present the following: your calculated t-value, an exact P-value using a computer or a range for the P-value using a table of critical values, and a statement about whether the population mean appears to be 3.4 or not based on the sample.
Correct Answer:
Verified
Q34: When a one sample t-test rejects the
Q35: If the 95% confidence interval of the
Q36: The t-test is very sensitive to deviations
Q37: To calculate the confidence intervals for variance
Q38: Calculation of the confidence intervals for variance
Q40: Consider the figure shown indicating the number
Q41: Consider a study on the diet
Q42: Consider a study on the diet
Q43: Consider a sample with 25 values that
Q44: Consider a sample with 21 values that
Unlock this Answer For Free Now!
View this answer and more for free by performing one of the following actions

Scan the QR code to install the App and get 2 free unlocks

Unlock quizzes for free by uploading documents