The country described in the table below produces and consumes only three goods: energy drinks, pizza, and t-shirts. The quantity produced and price of each good in 2016 and 2017 are provided.
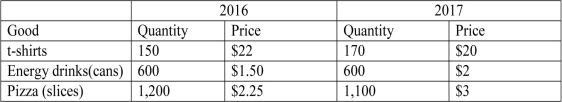
-Refer to the above table.Assuming that 2017 is the base year,by what percentage did real GDP grow between 2016 and 2017?
A) 1.3 percent
B) 1.6 percent
C) 1.9 percent
D) 2.2 percent
Correct Answer:
Verified
Q195: The country described in the table below
Q196: In a particular year,if the real GDP
Q197: The country described in the table below
Q198: The country described in the table below
Q199: The GDP deflator is 100 times the
Q201: The following table contains prices and quantities
Q202: The following table contains prices and quantities
Q203: The table below shows a list of
Q204: The table below contains data for a
Q205: The following table contains prices and quantities
Unlock this Answer For Free Now!
View this answer and more for free by performing one of the following actions

Scan the QR code to install the App and get 2 free unlocks

Unlock quizzes for free by uploading documents