The following figure shows two aggregate production functions.
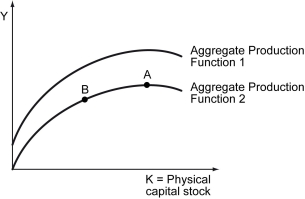
-Refer to the figure above.Assume the economy is at point B of the aggregate production function 2 in 2010.It will move toward point A in 2012 if the ________.
A) quantity of physical capital increases and technology remains constant
B) quantity of physical capital increases and technology increases
C) number of workers increases and technology remains constant
D) total efficiency units of labor increase and technology increases
Correct Answer:
Verified
Q109: Scenario: Red Country and Purple Country have
Q110: Scenario: Two economies, A and B, have
Q111: Scenario: Tree Country has a population of
Q112: Scenario: Red Country and Purple Country have
Q113: Scenario: Red Country and Purple Country have
Q115: Scenario: Red Country and Purple Country have
Q116: Scenario: Tree Country has a population of
Q117: The following figure shows two aggregate production
Q118: Scenario: Red Country and Purple Country have
Q119: Scenario: Two economies, A and B, have
Unlock this Answer For Free Now!
View this answer and more for free by performing one of the following actions

Scan the QR code to install the App and get 2 free unlocks

Unlock quizzes for free by uploading documents