This diagram shows hypothetical demand curves for individuals A and B.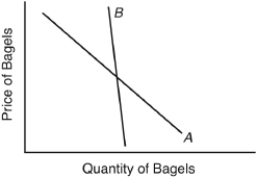
The differences in their slopes suggest that consumer A and consumer B
A) have very different income levels.
B) have different tastes.
C) are not subject to the law of diminishing marginal utility.
D) are charged different prices for the same commodity.
E) are offered different amounts to purchase.
Correct Answer:
Verified
Q16: The law of diminishing marginal utility implies
Q17: The following question are based on the
Q18: Approximately what percentage of their income do
Q19: In a market economy,consumer purchases depend on
Q20: Approximately what percentage of their income do
Q22: Short-run costs that do not change as
Q23: Opportunity cost is
A) the variable cost a
Q24: The distinction between the short run and
Q25: The next question is based on the
Q26: Another name for opportunity cost is _
Unlock this Answer For Free Now!
View this answer and more for free by performing one of the following actions

Scan the QR code to install the App and get 2 free unlocks

Unlock quizzes for free by uploading documents