The figure given below represents the saving function of an economy.
Figure 9.1
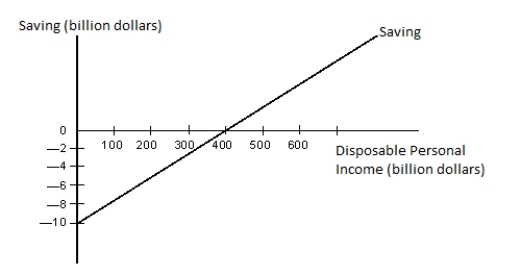
-Refer to Figure 9.1. When disposable income equals zero:
A) autonomous consumption equals zero.
B) the maximum amount of saving equals $10 billion.
C) autonomous income equals $10 billion.
D) autonomous consumption equals $10 billion.
E) consumption is negative.
Correct Answer:
Verified
Q3: Suppose two successive levels of disposable personal
Q5: The consumption function illustrates that:
A)saving increases as
Q6: Identify the correct statement.
A)Autonomous consumption equals saving
Q12: Dissaving occurs when:
A)disposable income is greater than
Q13: The figure given below represents the saving
Q15: A key assumption of the Keynesian model
Q17: Identify the correct statement with respect to
Q20: Which of the following is a stock
Q22: The figure given below shows the consumption
Q25: A change in the marginal propensity to
Unlock this Answer For Free Now!
View this answer and more for free by performing one of the following actions

Scan the QR code to install the App and get 2 free unlocks

Unlock quizzes for free by uploading documents