The figure given below represents the consumption function of a country.
Figure 9.3
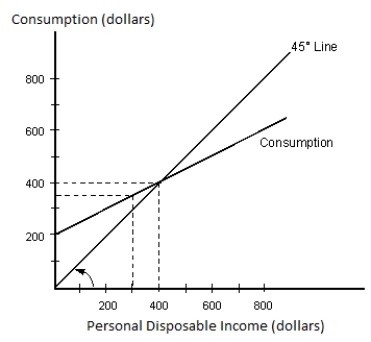
-According to Figure 9.3, saving is zero when disposable income is _____.
A) $0
B) $400
C) $250
D) $800
E) $300
Correct Answer:
Verified
Q23: Suppose total disposable income in Country X
Q24: If a household experiences a $880 increase
Q33: The table given below reports the
Q34: The figure given below shows the consumption
Q35: The figure given below represents the consumption
Q36: The figure given below shows the consumption
Q38: The figure given below shows the consumption
Q39: The figure given below shows the consumption
Q41: The figure given below shows the consumption
Q42: The table given below reports the
Unlock this Answer For Free Now!
View this answer and more for free by performing one of the following actions

Scan the QR code to install the App and get 2 free unlocks

Unlock quizzes for free by uploading documents