The figure given below shows the consumption functions of an economy.?Figure 9.4
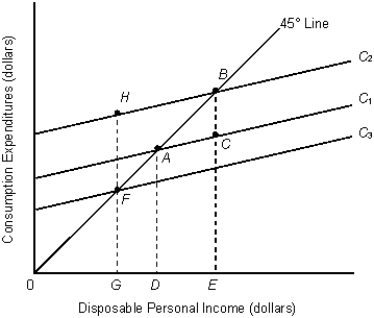
-Refer to Figure 9.4. Which of the following could explain a downward shift of the consumption function from C₁ to C₃?
A) An increase in household wealth
B) A decrease in the proportion of young people in the population
C) An increase in the size of the population
D) A decrease in consumer confidence
E) An autonomous decrease in saving
Correct Answer:
Verified
Q43: A change in consumption caused by a
Q44: Which of the following is true of
Q44: The table given below reports the consumption
Q46: Which of the following is a determinant
Unlock this Answer For Free Now!
View this answer and more for free by performing one of the following actions

Scan the QR code to install the App and get 2 free unlocks

Unlock quizzes for free by uploading documents