The figure given below shows the aggregate expenditures function of an economy.?Figure 9.5
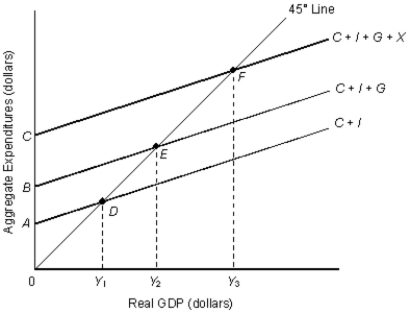
-Refer to Figure 9.5. The amount of government spending is indicated by the distance _____.
A) Y₁Y₂
B) EF
C) Y₂Y₃
D) BC
E) AB
Correct Answer:
Verified
Q64: In most derivations of the aggregate expenditures
Q89: Dissaving occurs when the consumption function lies
Q92: In the table given below Y
Q93: An increase in disposable income will cause
Q94: Saving remaining constant, the average propensity to
Q97: The consumption function has a positive slope
Q98: If disposable income rises from $15, 000
Q98: The figure given below shows the aggregate
Q101: Other things equal, a marginal propensity to
Q102: Other things equal, when the U.S.dollar depreciates,
Unlock this Answer For Free Now!
View this answer and more for free by performing one of the following actions

Scan the QR code to install the App and get 2 free unlocks

Unlock quizzes for free by uploading documents