Figure 15.1 shows the market for the Swiss franc.In the figure,the initial demand for marks and supply of marks are depicted by D0 and S0 respectively.
Figure 15.1.The Market for the Swiss Franc 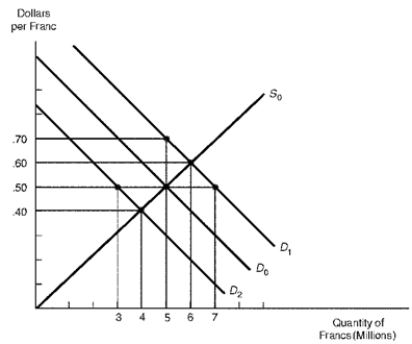
-Refer to Figure 15.1.Suppose the United States decreases investment spending in Switzerland,thus reducing the demand for francs from D0 to D2.Under a floating exchange rate system,the new equilibrium exchange rate would be:
A) $0.40 per franc
B) $0.50 per franc
C) $0.60 per franc
D) $0.70 per franc
Correct Answer:
Verified
Q27: Figure 15.1 shows the market for the
Q42: If Mexico dollarizes its economy,it essentially
A) Allows
Q43: Under managed floating exchange rates,the Federal Reserve
Q44: Table 15.1.
The Market for Francs

Q46: If Mexico fully dollarizes its economy,it agrees
Q47: To defend a pegged exchange rate that
Q48: Table 15.1.
The Market for Francs
Q55: Given a two-country world,suppose Japan revalues the
Q56: Figure 15.1 shows the market for the
Q60: Given a two-country world,assume Canada and Sweden
Unlock this Answer For Free Now!
View this answer and more for free by performing one of the following actions

Scan the QR code to install the App and get 2 free unlocks

Unlock quizzes for free by uploading documents