Exhibit 5.1
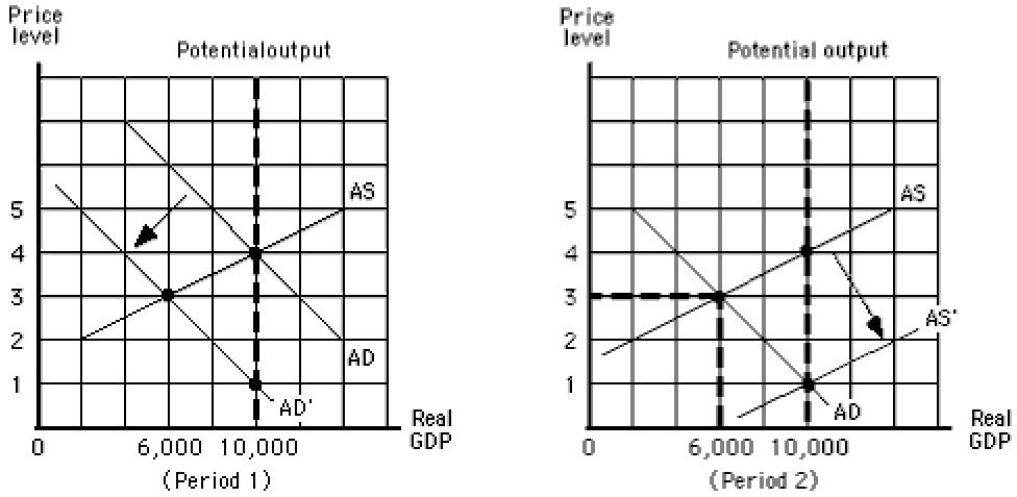
-Refer to Exhibit 5.1, which shows the aggregate demand and supply curves for the United States. From the beginning of period 1 to the end of period 2, _____
A) real GDP decreased and then increased.
B) real GDP increased and then decreased.
C) real GDP fell from $10,000 to $6,000.
D) real GDP remained constant at $6,000.
E) the inflation rate fell from 4 percent to 2 percent.
Correct Answer:
Verified
Q74: Given an aggregate supply curve,a decrease in
Q113: When did the longest contraction on record
Q114: Which of the following occurred in the
Unlock this Answer For Free Now!
View this answer and more for free by performing one of the following actions

Scan the QR code to install the App and get 2 free unlocks

Unlock quizzes for free by uploading documents