Exhibit 10.1
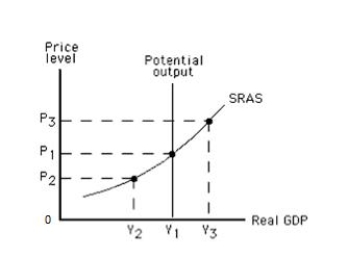
-Refer to Exhibit 10.1, which shows the short-run aggregate supply (SRAS) curve of an economy. To the left of Y₁, _____
A) output levels are at the economy's potential.
B) output levels are more than the economy's potential.
C) output levels are less than the economy's potential.
D) unemployment is at the natural rate.
E) unemployment is lower than the natural rate.
Correct Answer:
Verified
Q36: The slope of the short-run aggregate supply
Q39: Which of the following is true if
Q47: Exhibit 10.1 Q47: Exhibit 10.1 Q49: If the actual price level is less Q50: Which of the following is true in Q51: Which of the following explains the shape Unlock this Answer For Free Now! View this answer and more for free by performing one of the following actions Scan the QR code to install the App and get 2 free unlocks Unlock quizzes for free by uploading documents
![]()
![]()

