Exhibit 15.5
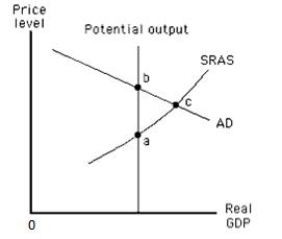
-Exhibit 15.5 depicts the aggregate demand curve and the short-run aggregate supply curve of an economy. In this figure, short-run equilibrium occurs at _____
A) point b, where actual output exceeds potential output.
B) point a, where actual output exceeds potential output.
C) point c, where the actual price level exceeds the expected price level.
D) point c, where the actual price level is less than the expected price level.
E) point b, where the actual price level exceeds the expected price level.
Correct Answer:
Verified
Q81: Exhibit 15.4 Q82: Exhibit 15.6 Q82: When the short-run aggregate supply curve is Q83: Over the past 40 years, the most Q85: Which of the following changes is observed Q89: Which of the following is an example Q90: In the summer of 1999, the FOMC Unlock this Answer For Free Now! View this answer and more for free by performing one of the following actions Scan the QR code to install the App and get 2 free unlocks Unlock quizzes for free by uploading documents
![]()
![]()

