Multiple Choice
Figure 7C
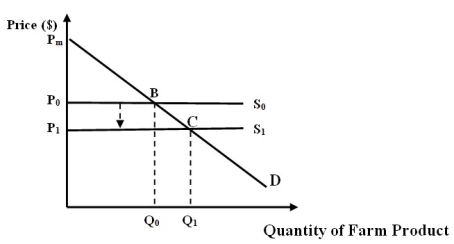
-Refer to Figure 7C. Assume that the farm product is grapes for wine-making. Also assume that the market for grapes is defined by the demand curve, D, and the supply curve, S1. Which of the following areas represents consumer surplus for this market?
A) Triangle pmcp1.
B) Triangle pmbp0.
C) Area P1BCP0.
D) None of these areas.
Correct Answer:
Verified
Related Questions

