Figure 12.1 Aggregate Supply and Aggregate Demand
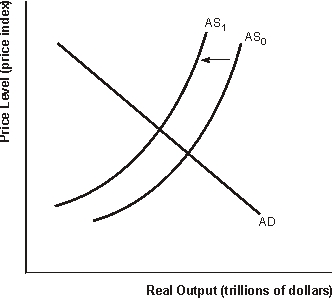
-Refer to Figure 12.1. The shape of the aggregate supply curve AS0 shows that the economy is initially operating in a range at which the economy is
A) in a severe recession
B) about to collapse
C) approaching full employment
D) experiencing high inflation
Correct Answer:
Verified
Q68: If the MPS = 0.1, then the
Q69: Figure 12.1 Aggregate Supply and Aggregate Demand
Q70: Figure 12.1 Aggregate Supply and Aggregate Demand
Q71: Figure 12.1 Aggregate Supply and Aggregate Demand
Q72: Figure 12.1 Aggregate Supply and Aggregate Demand
Q74: The Information Age technology revolution is causing
Q75: According to Keynes, which policy would be
Q76: What initiated the early 1990's recession in
Q77: During the late 1970's, what economic situation
Q78: The low inflation of the late 1990s,
Unlock this Answer For Free Now!
View this answer and more for free by performing one of the following actions

Scan the QR code to install the App and get 2 free unlocks

Unlock quizzes for free by uploading documents