Figure 11.2
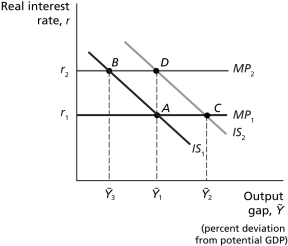
-Refer to Figure 11.2..Assume the economy is in equilibrium at Ȳ₁,where real GDP equals potential GDP,and then the economy experiences a negative demand shock.Other things equal,the negative demand shock is best represented by a(n)
A) movement up along the Phillips curve.
B) movement down along the Phillips curve.
C) upward shift of the Phillips curve.
D) downward shift of the Phillips curve.
Correct Answer:
Verified
Q16: When the Phillips curve was viewed as
Q17: Once the Phillips curve has shifted down,the
Q18: Negative demand shocks have a tendency to
Q19: Once economists take into consideration changes in
Q20: An increase in the unemployment rate that
Q22: Suppose the economy is in equilibrium with
Q23: Figure 11.1 Q24: Figure 11.2 Q25: Suppose the economy is in equilibrium with Q26: Figure 11.2 Unlock this Answer For Free Now! View this answer and more for free by performing one of the following actions Scan the QR code to install the App and get 2 free unlocks Unlock quizzes for free by uploading documents
![]()
![]()
![]()

