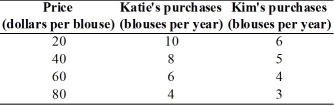
-The table above shows how many blouses Katie and Kim will purchase at different prices for a blouse.In the figure,label the axes and put the price on the y-axis and the quantity of blouses on the x-axis.Plot the data for Katie in the figure.Then,plot the data for Kim in the figure.
Correct Answer:
Verified
View Answer
Unlock this answer now
Get Access to more Verified Answers free of charge
Q221: Explain whether the statement "The government should
Q223: Define marginal cost and marginal benefit.
Q237: What is the difference between positive and
Q295: Q302: The question "Will doctors or lawyers have Q304: List and explain the three fundamental economic Q317: Why does scarcity lead to the what,how,and Q317: What is a positive statement? Give an Q320: Shaniq can spend the next hour studying Q321: ![]()
![]()
Unlock this Answer For Free Now!
View this answer and more for free by performing one of the following actions

Scan the QR code to install the App and get 2 free unlocks

Unlock quizzes for free by uploading documents