Describe each figure below as a frequency polygon, histogram, or line graph.
-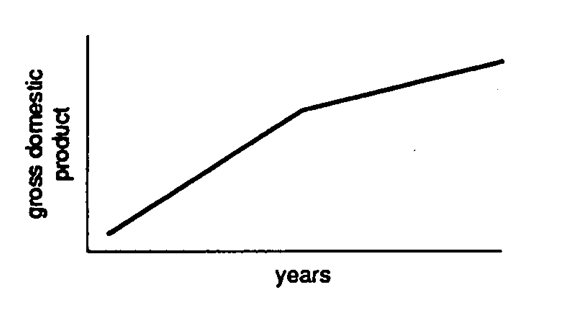
A) frequency polygon
B) histogram
C) line graph
Correct Answer:
Verified
Q69: Describe each figure below as a frequency
Q70: Describe each figure below as a frequency
Q71: Describe each figure below as a frequency
Q72: Describe each figure below as a frequency
Q73: Describe each figure below as a frequency
Q75: Identify each graph below as correct or
Q76: Identify each graph below as correct or
Q77: Identify each graph below as correct or
Q78: Identify each graph below as correct or
Q79: Describe each graph below as correct or
Unlock this Answer For Free Now!
View this answer and more for free by performing one of the following actions

Scan the QR code to install the App and get 2 free unlocks

Unlock quizzes for free by uploading documents