Data Set 13-9: Each point represents a mean based on 5 scores.
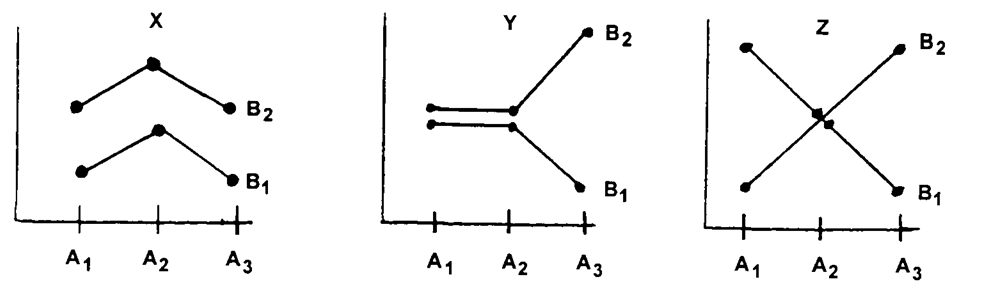
-The data in Data Set 13-9 are all examples of afactorial ANOVA.
A) 2x2
B) 2x3
C) 3x3
Correct Answer:
Verified
Q60: Data Set 13-8: N = 10 for
Q61: Data Set 13-8: N = 10 for
Q62: Data Set 13-9: Each point represents a
Q63: Data Set 13-9: Each point represents a
Q64: Data Set 13-9: Each point represents a
Q66: Data Set 13-10: The bar graphs show
Q67: Data Set 13-10: The bar graphs show
Q68: Data Set 13-10: The bar graphs show
Q69: Data Set 13-10: The bar graphs show
Q70: Among behavioral scientists, factorial ANOVA designs were
Unlock this Answer For Free Now!
View this answer and more for free by performing one of the following actions

Scan the QR code to install the App and get 2 free unlocks

Unlock quizzes for free by uploading documents