Multiple Choice
Figure 4-10
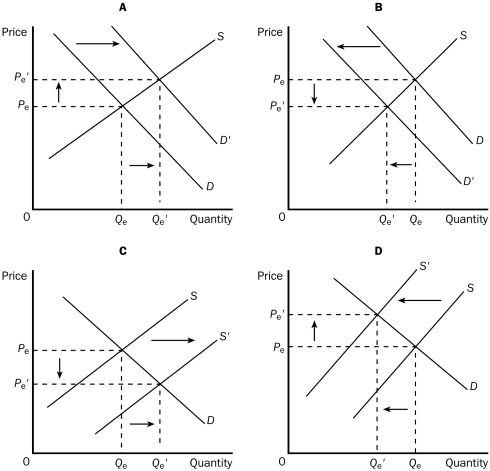
-Refer to Figure 4-10.Which of the four graphs represents the market for cars as a result of the adoption of new technology on assembly lines?
A) A
B) B
C) C
D) D
Correct Answer:
Verified
Related Questions
Q115: Holding all other things constant,a higher price
Q199: Figure 4-9
![]()

