Figure 5-8. A demand curve is shown on the graph below. On the graph, Q represents quantity demanded and P represents price.
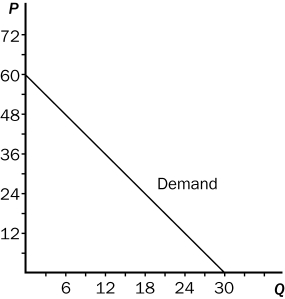
-Refer to Figure 5-8.Using the midpoint method,between prices of $12 and $18,price elasticity of demand is
A) 0.33.
B) 0.67.
C) 1.33.
D) 1.89.
Correct Answer:
Verified
Q103: Figure 5-6 Q105: Figure 5-8. A demand curve is shown Q108: Figure 5-7 Q110: Figure 5-8. A demand curve is shown Q160: When demand is inelastic,the price elasticity of Q163: If the demand for donuts is elastic,then Q169: If the price elasticity of demand for Q189: If the price elasticity of demand for Q267: When demand is inelastic within a certain Q279: An increase in price causes an increase
![]()
![]()
Unlock this Answer For Free Now!
View this answer and more for free by performing one of the following actions

Scan the QR code to install the App and get 2 free unlocks

Unlock quizzes for free by uploading documents