Multiple Choice
In the following figure the curve is the graph of a quantity y that is a function of time t. Also shown is its tangent line at t = 100. What is the average rate of change of y from t = 20 to t = 160? What is the approximate rate of change of y with respect to t at t = 100? 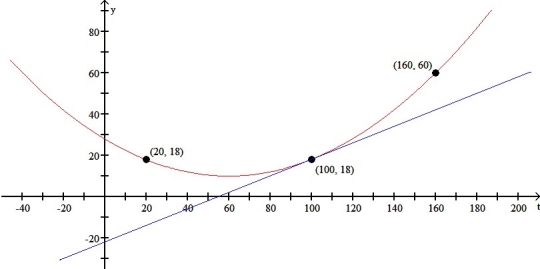
A)  ,
, 
B)  ,
, 
C)  ,
, 
D)  ,
, 
E) none of the above
Correct Answer:
Verified
Related Questions

