According to the 2019 U.S. Census Bureau estimates, 63.4% of the U.S. self-identifies as Non-Hispanic white, 15.3% as Hispanic and Latino, 13.4% as Black or African American, 5.9% as Asian, and 2.0% as Other. A random sample of 1000 students graduating from California colleges and universities resulted in the following data on self-identified race: 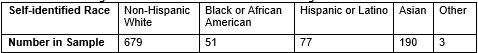 You would like to determine if the distribution of self-identified race among California college and university students differs from the distribution of self-identified race in the U.S. overall.
-Use the Goodness of Fit applet to conduct a simulation-based chi-square goodness-of-fit test using the chi-square statistic, and report the statistic and the p-value. Use at least 1000 shuffles.
chi-square statistic =
p-value =
Correct Answer:
Verified
View Answer
Unlock this answer now
Get Access to more Verified Answers free of charge
Q36: Are people equally likely to be born
Q37: Are people equally likely to be born
Q38: Are people equally likely to be born
Q39: Are people equally likely to be born
Q40: According to the 2019 U.S. Census Bureau
Q41: According to the 2019 U.S. Census Bureau
Q42: According to the 2019 U.S. Census Bureau
Q44: According to the 2019 U.S. Census Bureau
Q45: According to the 2019 U.S. Census Bureau
Q46: According to the 2019 U.S. Census Bureau
Unlock this Answer For Free Now!
View this answer and more for free by performing one of the following actions

Scan the QR code to install the App and get 2 free unlocks

Unlock quizzes for free by uploading documents