The table below gives the number of ants living in a museum display. Use linear regression on the values t and 
to fit a function of the form

.
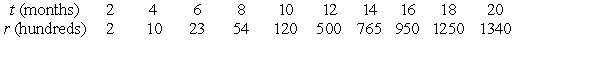 Use a calculator program to find the regression line for this data. Use the regression line to calculate the number of ants after 22 months. Give your answer to the nearest whole number.
Correct Answer:
Verified
Q9: The following table gives v as a
Q10: The following table gives v as a
Q11: The following table gives v as a
Q12: The following table gives v as a
Q13: Use linear regression on the values t
Q15: Use linear regression on the values x
Q16: Use linear regression on the values x
Q17: Use linear regression on the values x
Q18: Use linear regression on the values x
Q19: Use linear regression on the values x
Unlock this Answer For Free Now!
View this answer and more for free by performing one of the following actions

Scan the QR code to install the App and get 2 free unlocks

Unlock quizzes for free by uploading documents