Each of the functions in the table below is increasing, but each increases in a different way. One is linear, one is exponential, and one is neither.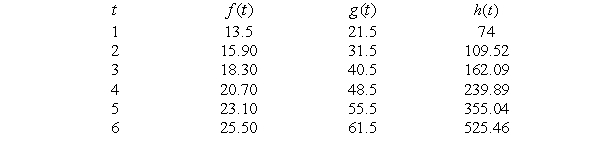 The following three graphs correspond with the functions in the table. Which is the graph of g?
A) 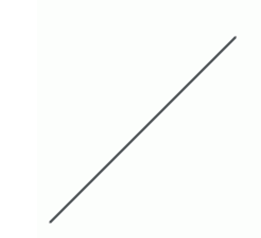
B) 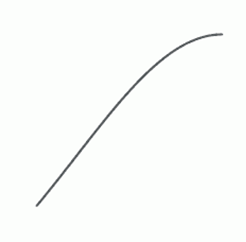
C) 
Correct Answer:
Verified
Q77: A biologist measures the amount of contaminant
Q78: Q79: Q80: The following figure shows two functions, one Q81: Each of the functions in the table Q83: Each of the functions in the table Q84: The population of a city is increasing Q85: The formula for the exponential function f Q86: Find a possible formula for the exponential Q87: In the exponential formula ![]()
![]()

Unlock this Answer For Free Now!
View this answer and more for free by performing one of the following actions

Scan the QR code to install the App and get 2 free unlocks

Unlock quizzes for free by uploading documents