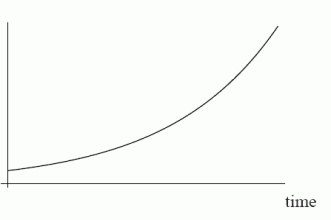
The number of cancer cells in a patient grows slowly at first, but then grows with increasing rapidity. Does the following figure accurately represent the number of cancer cells in a patient graphed against time?
Correct Answer:
Verified
Q1: A model rocket is launched from the
Q3: Which scenario below best matches the following
Q4: Calculate successive rates of change for the
Q5: Calculate successive rates of change for the
Q6: Does the following figure appear to be
Q7: Does the graph of 
Q8: The quantity of the drug in a
Q9: The rumor spread slowly--then faster--then slowly again.
Q10: Determine the concavity of the graph of
Q11: The car slowed down steadily. Which of
Unlock this Answer For Free Now!
View this answer and more for free by performing one of the following actions

Scan the QR code to install the App and get 2 free unlocks

Unlock quizzes for free by uploading documents