Short Answer
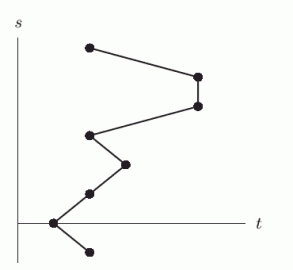
The data points for the following table are graphed in the figures below. 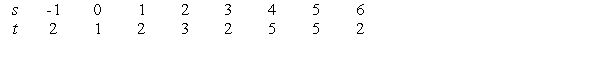
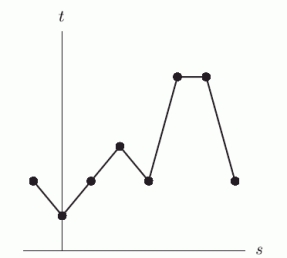
 For the graph that is a function, we could write _____ = f ( _____ ), where _____ is the dependent variable and _____ is the independent variable. (Fill in each blank with an "s" or a "t").
Correct Answer:
Verified
Related Questions

