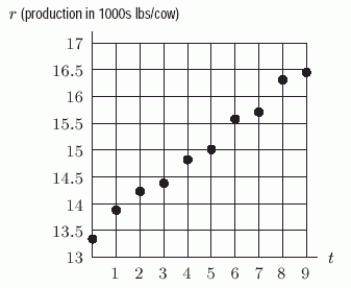
The following figure gives the annual amount of milk produced (in 1000s of pounds) per US milk cow as a function of t, the number of years since 1986. Is the regression line r = 0.34t + 13.4 reasonably correct?
Correct Answer:
Verified
Q1: Several years ago, the wild rabbits of
Q2: Several years ago, the wild rabbits of
Q3: Several years ago, the wild rabbits of
Q4: A study was done that collected data
Q6: The following table shows the cost of
Q7: The following table shows the cost of
Q8: The following figure shows scatter plots with
Q9: The following table gives the number P
Q10: The following table gives the number P
Q11: The following table shows the size of
Unlock this Answer For Free Now!
View this answer and more for free by performing one of the following actions

Scan the QR code to install the App and get 2 free unlocks

Unlock quizzes for free by uploading documents