Multiple Choice
Which of the following figures shows the graph of a person's weight, w, as a function of time t, in months if the person starts out at 150 pounds and loses 10 pounds a month?
A) 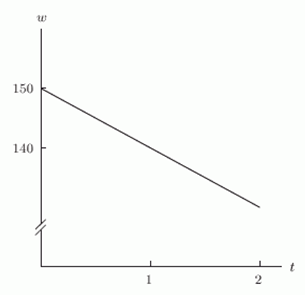
B) 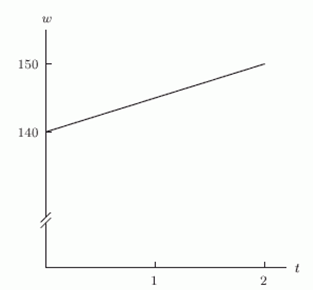
C) 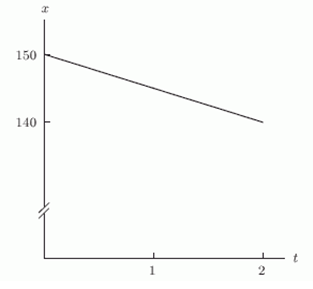
D) 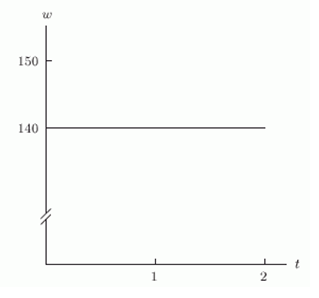
Correct Answer:
Verified
Related Questions
Q68: The distance traveled by a car is
Q69: The distance traveled by a car is
Q70: Could the following table represent a linear
Q71: Could the following table represent a linear
Q72: Could the following table represent a linear
Q74: One of the functions represented in the
Unlock this Answer For Free Now!
View this answer and more for free by performing one of the following actions

Scan the QR code to install the App and get 2 free unlocks

Unlock quizzes for free by uploading documents