Multiple Choice
Which of the following is a semi-log plot of the function 
A) 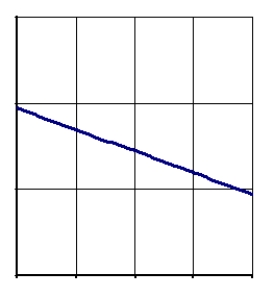
B) 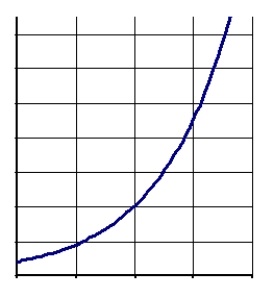
C) 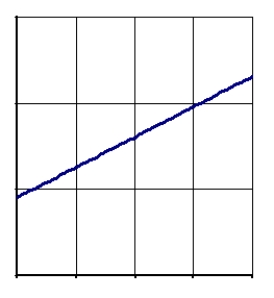
D) 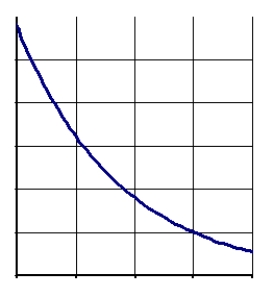
Correct Answer:
Verified
Related Questions
Q95: The noise level, N, of a sound
Q96: The noise level, N, of a sound
Q97: Examine the following graph: Q98: Given the graph: Q99: Which of the following functions would appear Q101: Graph the function Q102: Identify the scale used on the vertical Q103: Which of the following functions would not Q104: Find the formula for the function pictured Q105: Write the exponential function, Unlock this Answer For Free Now! View this answer and more for free by performing one of the following actions Scan the QR code to install the App and get 2 free unlocks Unlock quizzes for free by uploading documents![]()
![]()
![]()
![]()

