Complete the sentence to describe the graph shown:
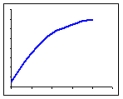
As x increases, the function A)____________(increases/decreases) at B)_____________ (an increasing/a decreasing/a constant) rate.
Correct Answer:
Verified
View Answer
Unlock this answer now
Get Access to more Verified Answers free of charge
Q20: The graph below displays the population of
Q21: If the average rate of change is
Q22: If the average rate of change is
Q23: If the function is increasing, then the
Q24: If the function is decreasing, then the
Q26: Complete the sentence to describe the graph
Q27: Choose the graph that is described by
Q28: The following table shows the size of
Q29: The following table shows the size of
Q30: The following table shows the size of
Unlock this Answer For Free Now!
View this answer and more for free by performing one of the following actions

Scan the QR code to install the App and get 2 free unlocks

Unlock quizzes for free by uploading documents