The following graph shows the population (in thousands) of two cities, City 1 and City 2.
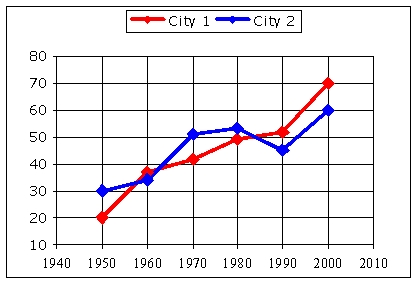
What year's census saw a decrease in city 2's population?
Correct Answer:
Verified
Q110: Find the range of this function. Express
Q111: Over what interval(s) is the function negative?
Write
Q112: Over what interval(s) is the function positive?
Write
Q113: Over what interval(s) is the function positive?
Write
Q114: Over what interval(s) is the function negative?
Write
Q116: The following graph shows the population (in
Q117: Which graph is increasing on the interval
Q118: Which graph is decreasing on the interval
Q119: Over what interval is the function increasing?
Write
Q120: Over what interval is the function increasing?
Write
Unlock this Answer For Free Now!
View this answer and more for free by performing one of the following actions

Scan the QR code to install the App and get 2 free unlocks

Unlock quizzes for free by uploading documents