The following diagram shows the demand curve for a product shifting from D0 to D1. Which of the following could have caused this shift? 
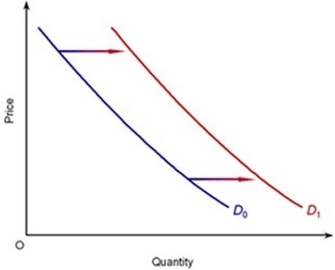
A) A fall in price of the product
B) A fall in price of a substitute product
C) A fall in income if the product is normal
D) A fall in price of a complementary product
Correct Answer:
Verified
Q8: The law of demand states that, other
Q9: Which of the following is held constant
Q10: The quantity demanded of PepsiTM has decreased.
Q11: Consider the market for red jeans. If
Q12: Which of the following is not a
Q14: Which of the following might shift the
Q15: If a computer games addict became unemployed
Q16: Which one of the following would shift
Q17: Which of the following might shift the
Q18: Consider the market for good Z. What
Unlock this Answer For Free Now!
View this answer and more for free by performing one of the following actions

Scan the QR code to install the App and get 2 free unlocks

Unlock quizzes for free by uploading documents