Multiple Choice
Use the figure below to answer the following question(s) .
Figure 7-6 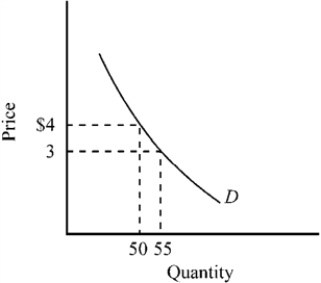
-In the price range between $3 and $4, the price elasticity of the demand curve depicted in Figure 7-6 is
A) highly elastic.
B) approximately equal to −0.33.
C) approximately equal to −3.
D) of unitary elasticity.
Correct Answer:
Verified
Related Questions
Q69: Suppose that the quantity of chain saws
Q70: Figure 7-2 Q71: If the price of gasoline goes up, Q72: A 10 percent increase in the price Q73: Figure 7-3 Q75: Studies indicate that the demand for fresh Unlock this Answer For Free Now! View this answer and more for free by performing one of the following actions Scan the QR code to install the App and get 2 free unlocks Unlock quizzes for free by uploading documents![]()
![]()

