The following chart represents the results of a two categorical variable study reflecting on education level survey in 2006 and the same survey results from 2016. Which type of chart is being displayed? 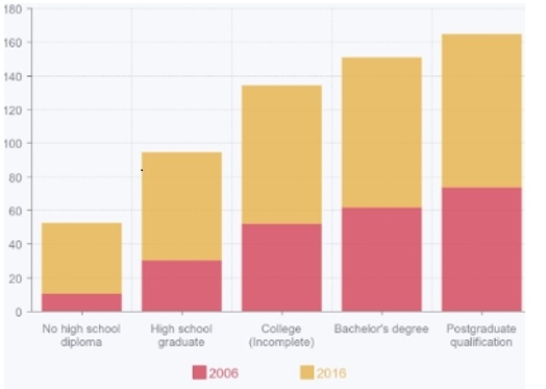
A) scatterplot
B) contingency table
C) histogram
D) stacked column chart
Correct Answer:
Verified
Q4: Bill wants to calculate the width of
Q5: Bill wants to calculate the width of
Q6: Marin produced the following histogram based on
Q7: Using the following histogram, how would the
Q8: As a researcher, you should be mindful
Q10: Below is the Scatterplot of 2 numeric
Q11: Simone is a marketing consultant hired to
Q12: What is the only meaningful measure of
Q13: What is the arithmetic mean in the
Q14: What is the arithmetic mean in the
Unlock this Answer For Free Now!
View this answer and more for free by performing one of the following actions

Scan the QR code to install the App and get 2 free unlocks

Unlock quizzes for free by uploading documents