Lauren launched her online boutique at the beginning of last year and would like to review her performance so far. She gathered the following information: 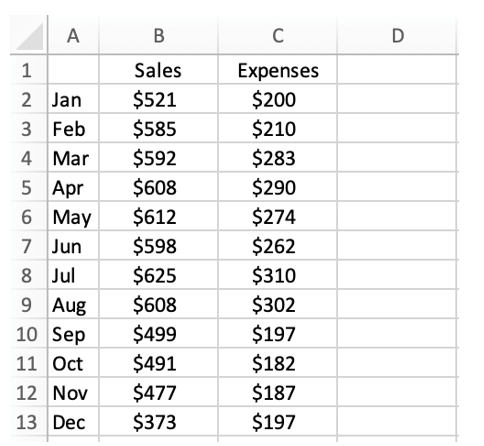 Lauren would like to use her data analytics skillset to help with her assessment of the year. Which graph would most accurately depict this data visually in a compelling manner?
A) A bar chart, it compares sales to expenses.
B) A histogram, it groups sales amounts and expenses within preset ranges.
C) A pie chart, it displays the overall amount of sales and expenses allocated to each month.
D) A time series graph, it shows how the sales and expenses change over the course of the year.
Correct Answer:
Verified
Q54: The management at Gellar Corp. is compiling
Q55: Tara oversees materials acquisition at an HVAC
Q56: Jessica recently compiled a budget for herself.
Q57: Jessica recently compiled a budget for herself.
Q58: Lauren launched her online boutique at the
Q60: The management at Gellar Corp. is compiling
Q61: Jordan is an economics student entering their
Q62: Jordan is an economics student entering their
Q63: Trevor is about to enter his third
Q64: Trevor is about to enter his third
Unlock this Answer For Free Now!
View this answer and more for free by performing one of the following actions

Scan the QR code to install the App and get 2 free unlocks

Unlock quizzes for free by uploading documents