Solve by graphing. Label the axes and show where the solution is located on the graph.
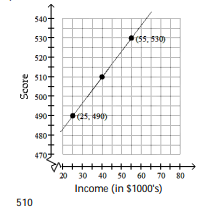
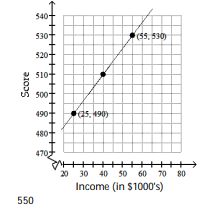
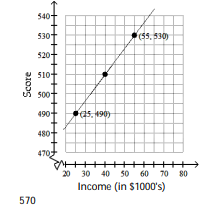
-The graph depicts a relationship between scores achieved on an unspecified standardized test and family income. Suppose the score for a test is 490 when the family income is $25,000 and is 530 when the family income is $55,000. Let x be the income and y be the score of the test. Graph the two given pairs of incomes and scores. Assume that the relationship is linear. Draw a line though the two previous points. From your graph, estimates the score if the family income is $40,000.
A) 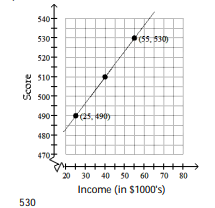
B)
C)
D)
Correct Answer:
Verified
Q84: Solve by graphing. Label the axes and
Q85: Solve by graphing. Label the axes and
Q86: Solve by graphing. Label the axes and
Q87: Solve by graphing. Label the axes and
Q88: Solve by graphing. Label the axes and
Q90: Answer the question
-The point at which a
Q91: Answer the question
-An equation of the type
Q92: Answer the question
-The graph of the equation
Q93: Answer the question
-The graph of the equation
Q94: Answer the question
-The graph of the equation
Unlock this Answer For Free Now!
View this answer and more for free by performing one of the following actions

Scan the QR code to install the App and get 2 free unlocks

Unlock quizzes for free by uploading documents