Solve the problem.
-The graph shows the sales of a particular brand of appliance from 1992 to 2010, where 1992 corresponds to x = 0. Two of the data points in the graph can be represented by the ordered pairs (0, 600) and (10, 2000) . Use these ordered pairs to write an equation of a line that models the data. Give the equation in slope- intercept form.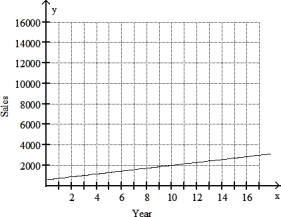
A) y = 60x + 2000
B) y = 140x + 600
C) y = 140x + 2000
D) y = 60 + 600
Correct Answer:
Verified
Q331: Write an equation for the line. Give
Q332: Write an equation for the line. Give
Q333: Graph the linear inequality
-x + y >
Q334: Graph the linear inequality
-5x - y
Q335: Solve the problem.
-The graph shows the sales
Q337: Solve the problem.
-Suppose that sales of a
Q338: Solve the problem.
-Suppose that sales of a
Q339: Decide whether the relation represents a function.
Q340: Decide whether the relation represents a function.
Q341: Solve.
-Use the vertical line test to determine
Unlock this Answer For Free Now!
View this answer and more for free by performing one of the following actions

Scan the QR code to install the App and get 2 free unlocks

Unlock quizzes for free by uploading documents