Which of the following is illustrated in the graph showing volume versus pressure in the lung-chest wall system?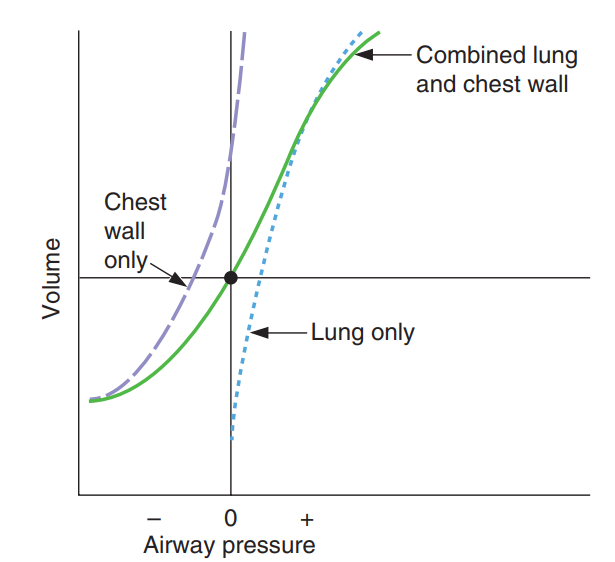
A) The slope of each of the curves is resistance
B) The compliance of the lungs alone is less than the compliance of the lungs plus chest wall
C) The compliance of the chest wall alone is less than the compliance of the lungs plus chest wall
D) When airway pressure is zero (atmospheric) , the volume of the combined system is the functional residual capacity (FRC)
E) When airway pressure is zero (atmospheric) , intrapleural pressure is zero
Correct Answer:
Verified
Q5: A 12-year-old boy has a severe
Q6: Which of the following is true during
Q7: Which volume remains in the lungs
Q8: A 35-year-old man has a vital
Q9: When a person is standing, blood flow
Q11: Which of the following is the site
Q12: A 49-year-old man has a pulmonary
Unlock this Answer For Free Now!
View this answer and more for free by performing one of the following actions

Scan the QR code to install the App and get 2 free unlocks

Unlock quizzes for free by uploading documents