The following figure plots Short Run Average Cost functions for small,medium,and large plants. Based on the figure and plots provided,for which quantity level is a medium plant the best choice? 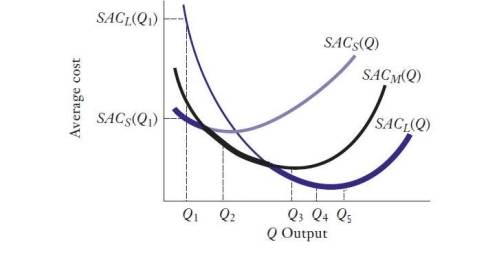
A) Q₁
B) Q₂
C) Q₃
D) Q₄
E) Q₅
Correct Answer:
Verified
Q3: In what special situation might the law
Q7: Which of the following best describes marginal
Q9: Which characteristic does not describe a perfectly
Q11: If TC(Q)=1000Q²+100Q+10,what is the formula for AC(Q)?
A)2000Q+100
B)2000Q²+100Q
C)1000Q²+100Q+10
D)1000Q+100+10/Q
E)100Q+10+1/Q
Q13: In which of the following markets is
Q16: At what point can a firm achieve
Q18: In which of the following markets is
Q19: If a firm is producing as efficiently
Q21: Suppose a firm's plant produces Q units
Q25: Suppose a firm's plant produces Q units
Unlock this Answer For Free Now!
View this answer and more for free by performing one of the following actions

Scan the QR code to install the App and get 2 free unlocks

Unlock quizzes for free by uploading documents