The table gives the high school dropout rate (as a percent of enrollment) in the United States for the years 2002 to 2008. (Source: United States Census Bureau, 2008)
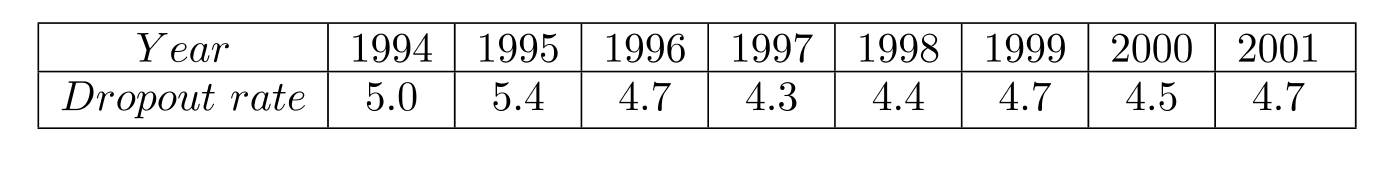
(a) Plot the data letting represent 2002, represent 2003, and so on.
(b) Find a function of the form that models this data. Let represent the vertex, and use (7,3.3) to determine the value of .
(c) Use the statistical capability of a graphing calculator to find the best-fitting quadratic function, , for this data. Graph both functions and from part (b) in the same window as the data points. Which function is the better fit?
Correct Answer:
Verified
Q1: Perform each operation with complex numbers.
Q2: For the quadratic function
Q3: (a) Solve the quadratic equation
Q4: The width of a rectangular box is
Q6: (a) Given that
Q7: Perform the following for the function
Q8: Perform the following for the function
Q9: (a) Use only a graphical method
Q10: Divide. Q11: Perform each operation with complex numbers.
(a)
Unlock this Answer For Free Now!
View this answer and more for free by performing one of the following actions

Scan the QR code to install the App and get 2 free unlocks

Unlock quizzes for free by uploading documents