The table gives the average price (in dollars) for a gallon of regular unleaded gasoline as measured in September of the years 2003 to 2009. (Source: The Bureau of Labor Statistics, 2009)
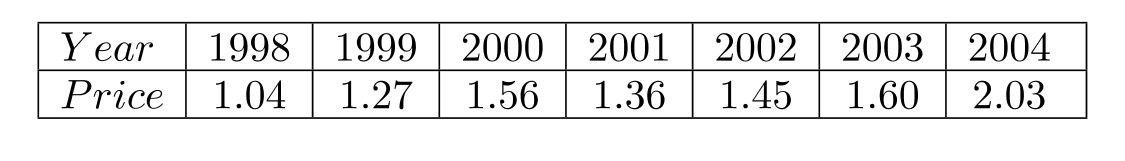
(a) Plot the data letting represent 2003, represent 2004, and so on.
(b) Find a function of the form that models this data. Let represent the vertex, and use to determine the value of .
(c) Use the statistical capability of a graphing calculator to find the best-fitting quadratic function, , for this data. Graph both functions and from part (b) in the same window as the data points. Which function is the better fit?
Correct Answer:
Verified
Q30: Divide. Q31: Perform each operation with complex numbers. Q32: For the quadratic function Q33: (a) Solve the quadratic equation Q34: The width of a rectangular box is Q36: (a) Given that Q37: Perform the following for the function Q38: Perform the following for the function Q39: (a) Use only a graphical method Q40: Divide.
(a)
(a)
Unlock this Answer For Free Now!
View this answer and more for free by performing one of the following actions

Scan the QR code to install the App and get 2 free unlocks

Unlock quizzes for free by uploading documents